

May 5, 2020 •DJ Team
Data, data everywhere, but what does it all mean? For today’s marketers, the digital analytics process might be a new or mystifying part of the job. On one hand, marketing data is awesome, because it gives you the potential to see exactly what is working, talk about your victories, and pivot efforts that aren’t paying off before they lead to waste.
On the other hand, the sheer amount of data that is available means you may only focus on the metrics you know. That doesn’t mean you won’t be successful, but it does mean you’re missing out on insights that could help your brand do even better. Here’s a look at what your data could be hiding, and some ways to uncover it that are easier than you might imagine.
First we need to cover a critical question: how do you analyse digital data? As lame as it might be, the answer to this question is part of a second question: What are the four types of analytics? Examining these different tiers of digital analytics is the first step to help you understand the work your data could be doing for you.
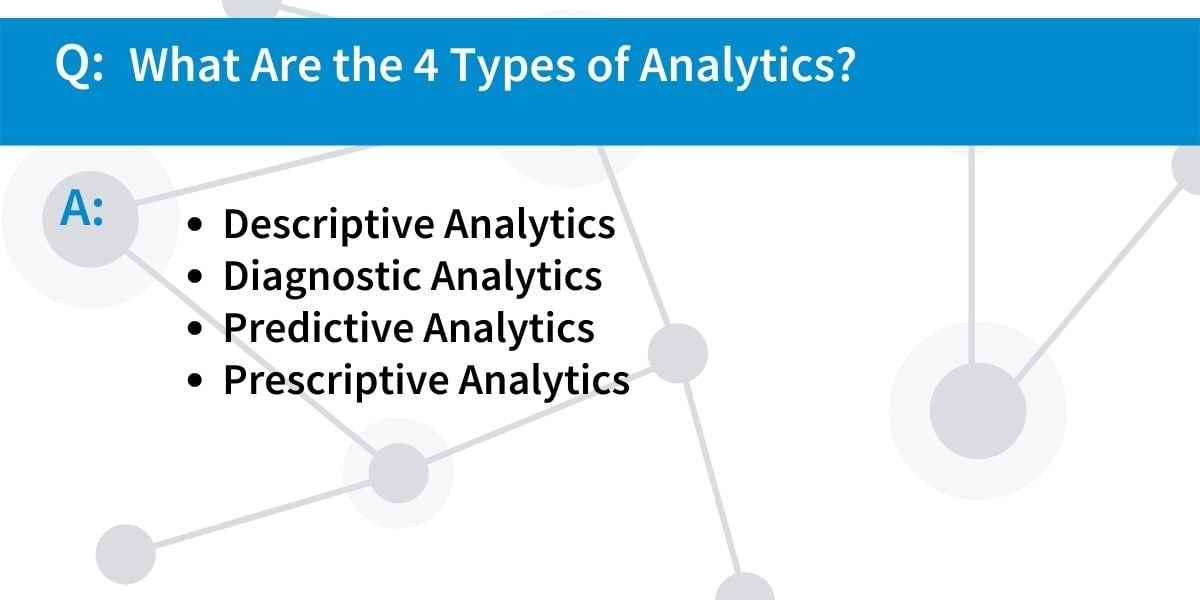
Different marketing analytics software tools make some of these approaches more accessible than others. Descriptive analytics and diagnostic analytics are used by most companies simply because they are easy to access through Google Analytics or other free marketing analytics tools. But with the big data trends 2020 has in store, marketers no longer have to be limited to just looking back at the past.
One way descriptive analytics and diagnostic analytics can reveal more with the same information is through how the data is collected and visualized. Historically it may have been one of the digital analyst roles and responsibilities to collect data about web traffic or marketing performance and put it in a chart or graph. Or, free marketing analytics tools might put lots of information in front of the marketing team without a clear way to understand what is being shown. Then it becomes someone’s role to figure out how parts of the data related to other parts, and to your goals.
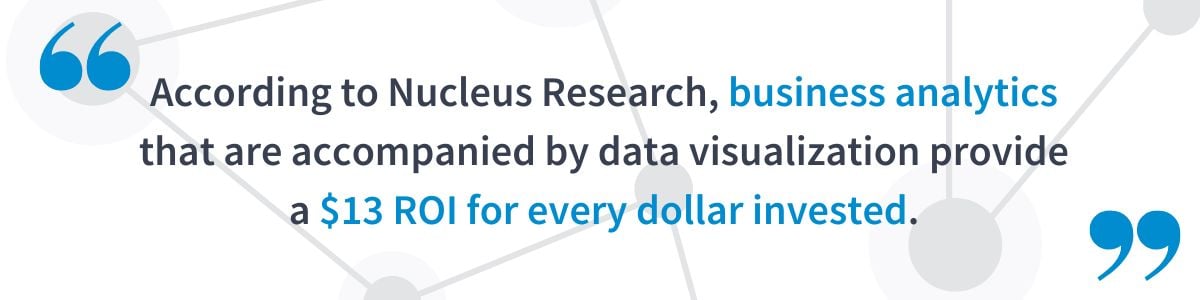
Understanding the kind of data visualization needed to solve this challenge goes back to the question “why is digital analytics important?” The web analytics tools you need are the ones that will help you understand how to get in front of your target customers at the moments that matter. This doesn’t just mean understanding the history of your web performance, which channels drive the most traffic, or the customer journey. It also means gaining insights into how your competitors were performing at the same time. According to Nucleus Research, business analytics that are accompanied by data visualization provide a $13 ROI for every dollar invested. When insights like these are visualized through a simple chart or graph and centralized in one tool, it helps marketers understand what they need to know now and take quick action to improve outcomes.
It’s not easy to put the past in perspective, but it’s even more difficult to see the future. The user journey to go from search engine or social media to your website or contact form won’t be the same for each person. That’s why predictive analytics are so essential to make the most of your marketing efforts.
For instance, say you want to run an ad on several social media channels, simply because you don’t know which one will be most successful. This means lots of time, effort, and money spent on ads that may or may not perform. With predictive analytics, you can get estimates in advance of how many people will see the ad, click it, and even buy as a result. Even better, this helps you understand how many new customers the ads are likely to generate and can even predict how much the average new customer will spend, so your company can make better inventory or staffing decisions.
Predictive analytics basically takes marketing attribution one step further. The AI doesn’t have to wonder, “What is the customer buying process?” and second-guess its instincts. Instead, by aggregating data, predictive analytics forecasts insights marketers need to compete with high traffic websites’ technology like large pay-per-click budgets or other SEO tools. The insight into what customers will do next doesn’t just help you improve results of your current campaign but is also how to increase organic traffic over time.
Whichever of the marketing analytics techniques you’re using, there’s no question that data is the foundation of how to create a digital marketing strategy. Without analytics that show marketing performance everywhere you are broadcasting the message, you can’t really understand the customer’s journey—or the competitive landscape your brand exists in. But how do you analyze digital marketing data? As we touched on with predictive analytics, these days digital marketing analytics is best done by a tool that specializes in sensibly and clearly visualizing marketing data. This is especially true when you are collecting data from so many social channels and other advertising platforms all in one place. Multi-channel attribution modeling enabled by technology gives a fuller picture of the real-time customer journey.
What is multi-channel attribution modeling? That’s when all the data collected from your digital presence is translated into a visual that helps you tell which channels are sending you the most traffic, and maybe even predicts where more traffic will come from in the future. If you’ve gotten so far as prescriptive analytics, you may even get suggestions for what topics will help drive traffic, or digital marketing examples from competitors.
When it comes to how to measure marketing attribution and the other benefits of digital analytics we’ve described, we created the DemandJump platform with all these features in one package. With a dashboard full of clearly-visualized data that helps you see the whole story of the customer journey, it’s easy to see which elements of marketing are performing best and where your focus will help other parts catch up. Plus, our augmented analytics tool draws insights from across your industry to take the guesswork out of the next piece of your strategy and help you stay ahead of the competition.
We’d love to show you the difference that this holistic cross-channel analytics view could make for your brand, and invite you to give us a test run with our free version.
